Run Reports
On the Analysis page, you can define the specific report criteria you want to see and compare your campaigns, newsletters, and broadcasts.
Reports let you retrieve data from Campaigns and Broadcasts based on common tags or naming conventions. With reports on the Analysis page, you might:
- Locate your top performing marketing campaigns.
- Analyze deliverability of all your transactional campaigns together.
- Compare journey volume and performance of two similar campaigns.
Each report might take a few seconds to run and will automatically run again when you change the report criteria. After results are returned, however, you can toggle any of the display options you’d like without re-running the full report.
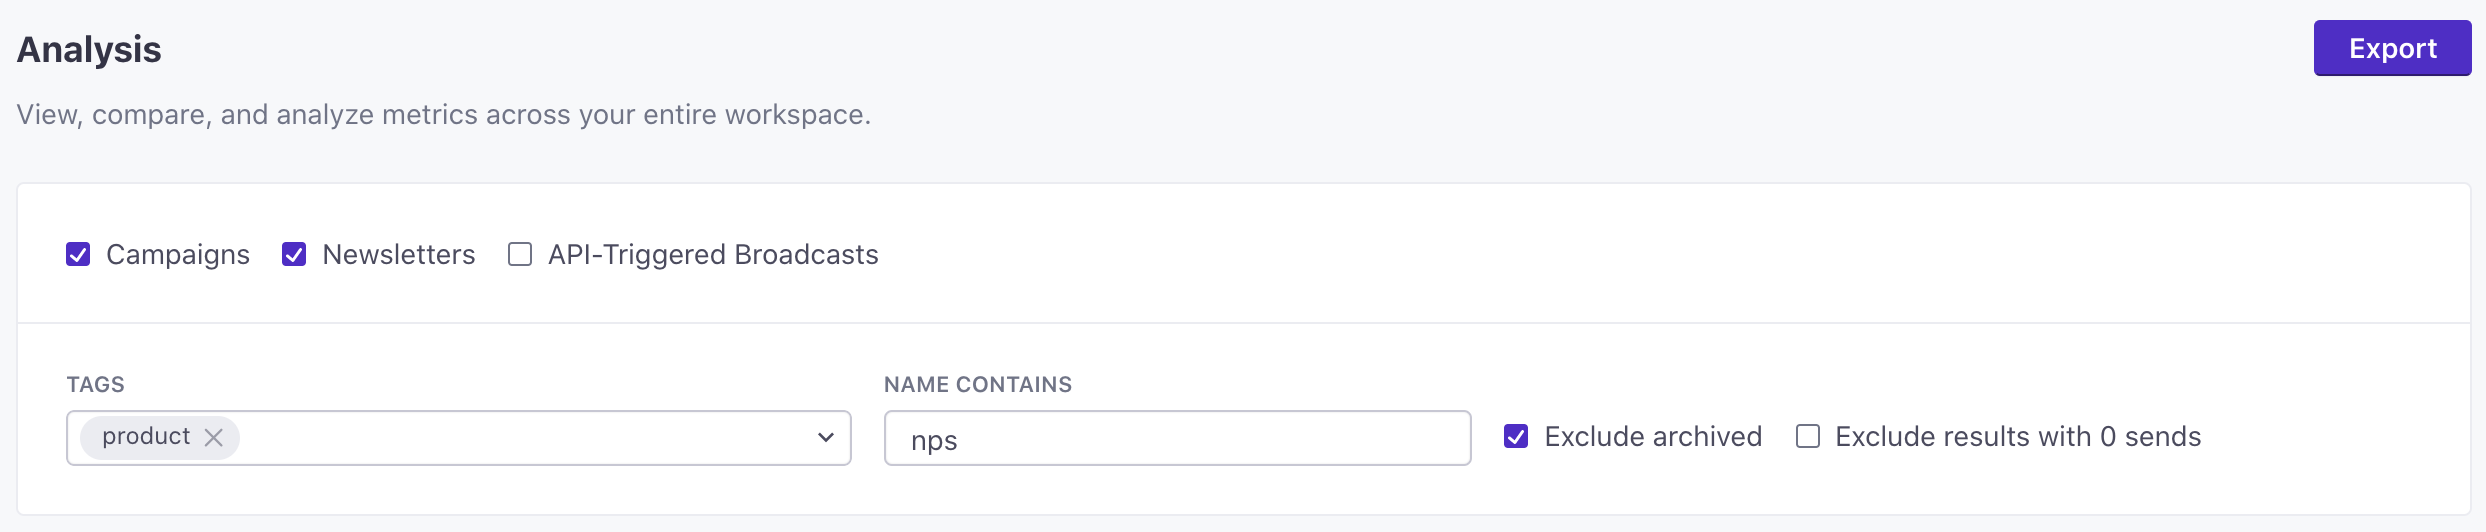
Table view
The table view of a report displays every Campaign, Newsletter, or Broadcast that met the report criteria in a table format. The top row of each report shows the cumulative total for all rows in the table. This allows you to understand the performance of an entire category of messages.
In the table view you can display any five metrics columns at a time, for any channel you prefer. Each column can be sorted, giving you the ability to locate top and bottom performing Campaigns or Broadcasts.
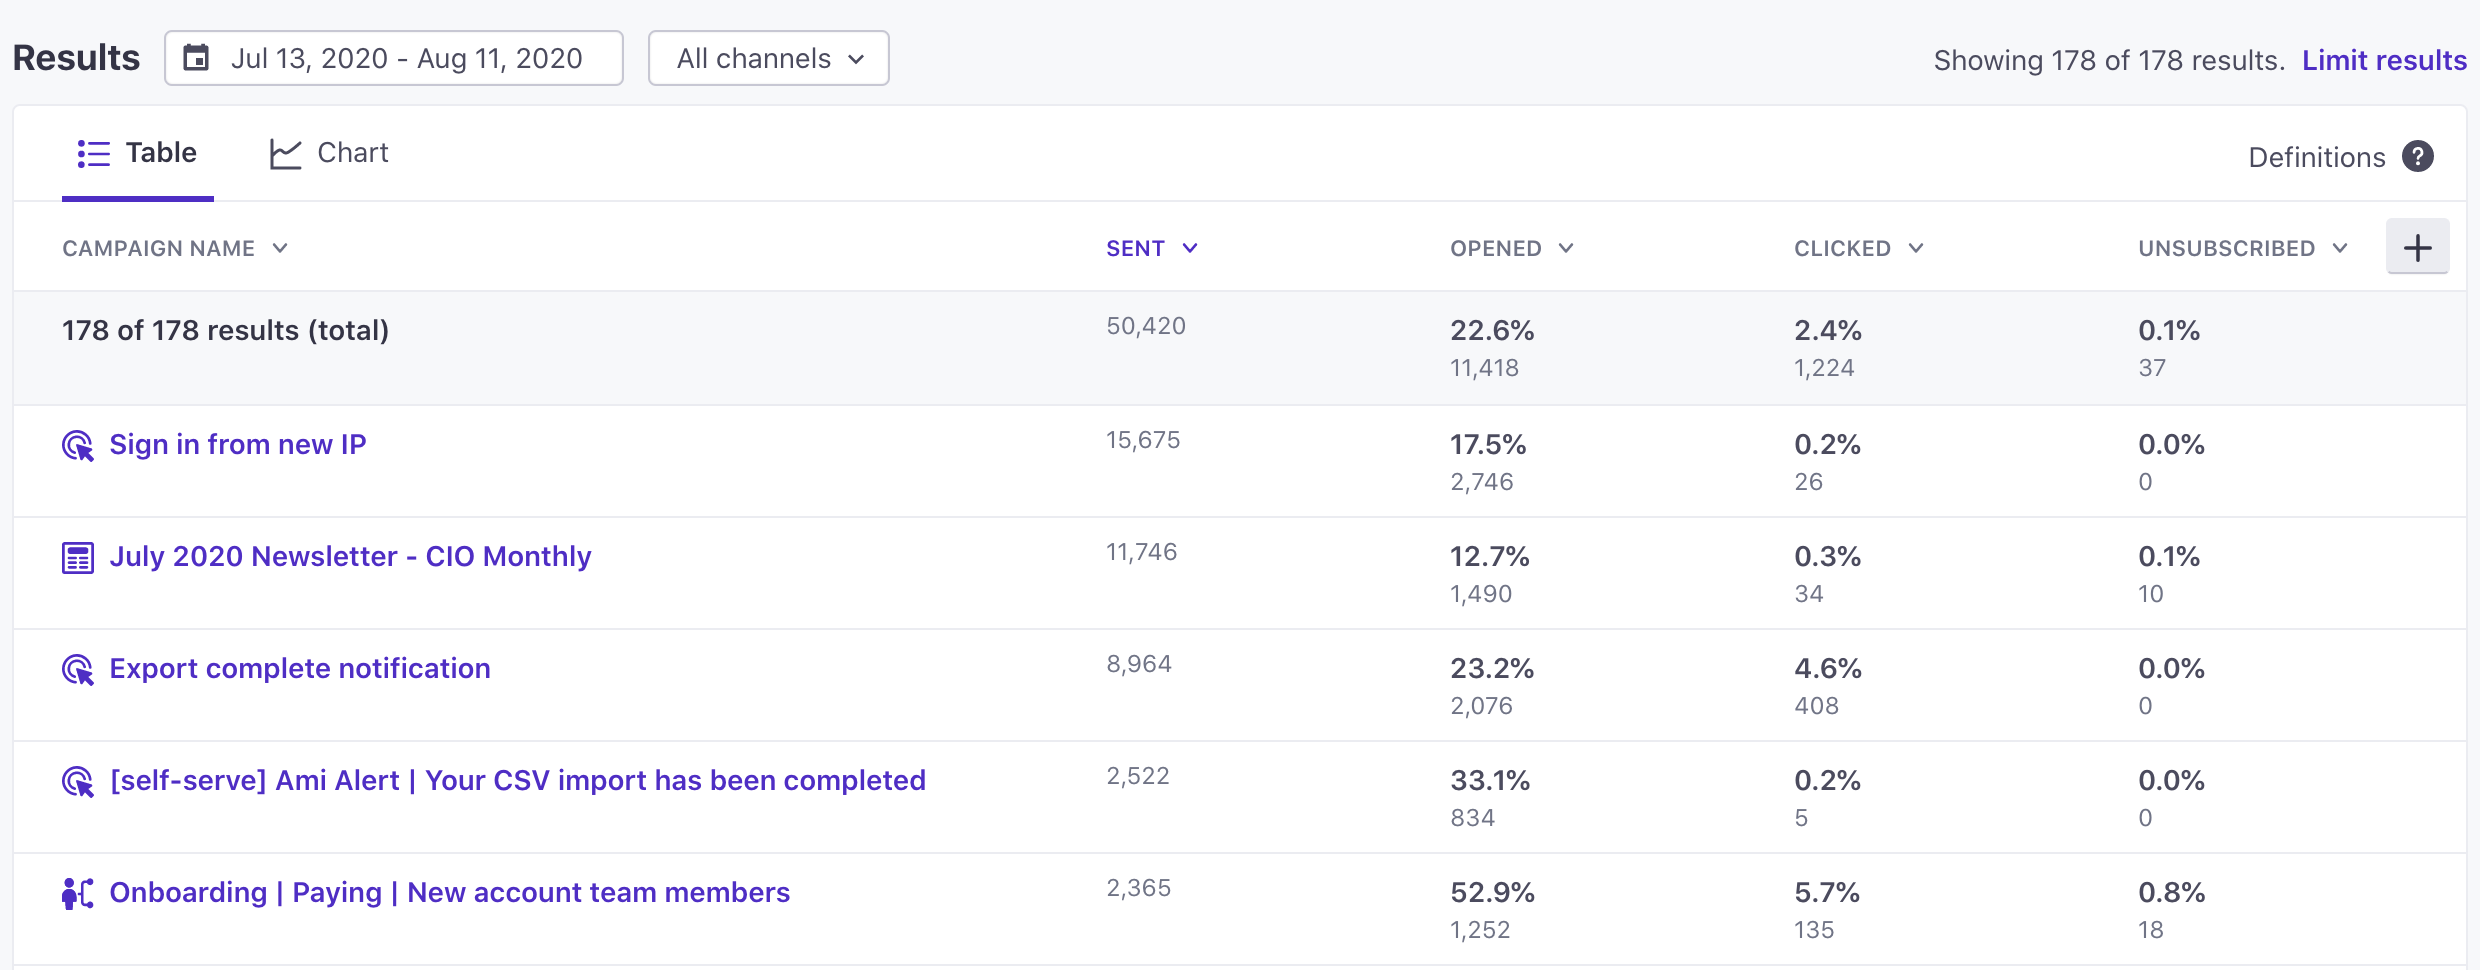
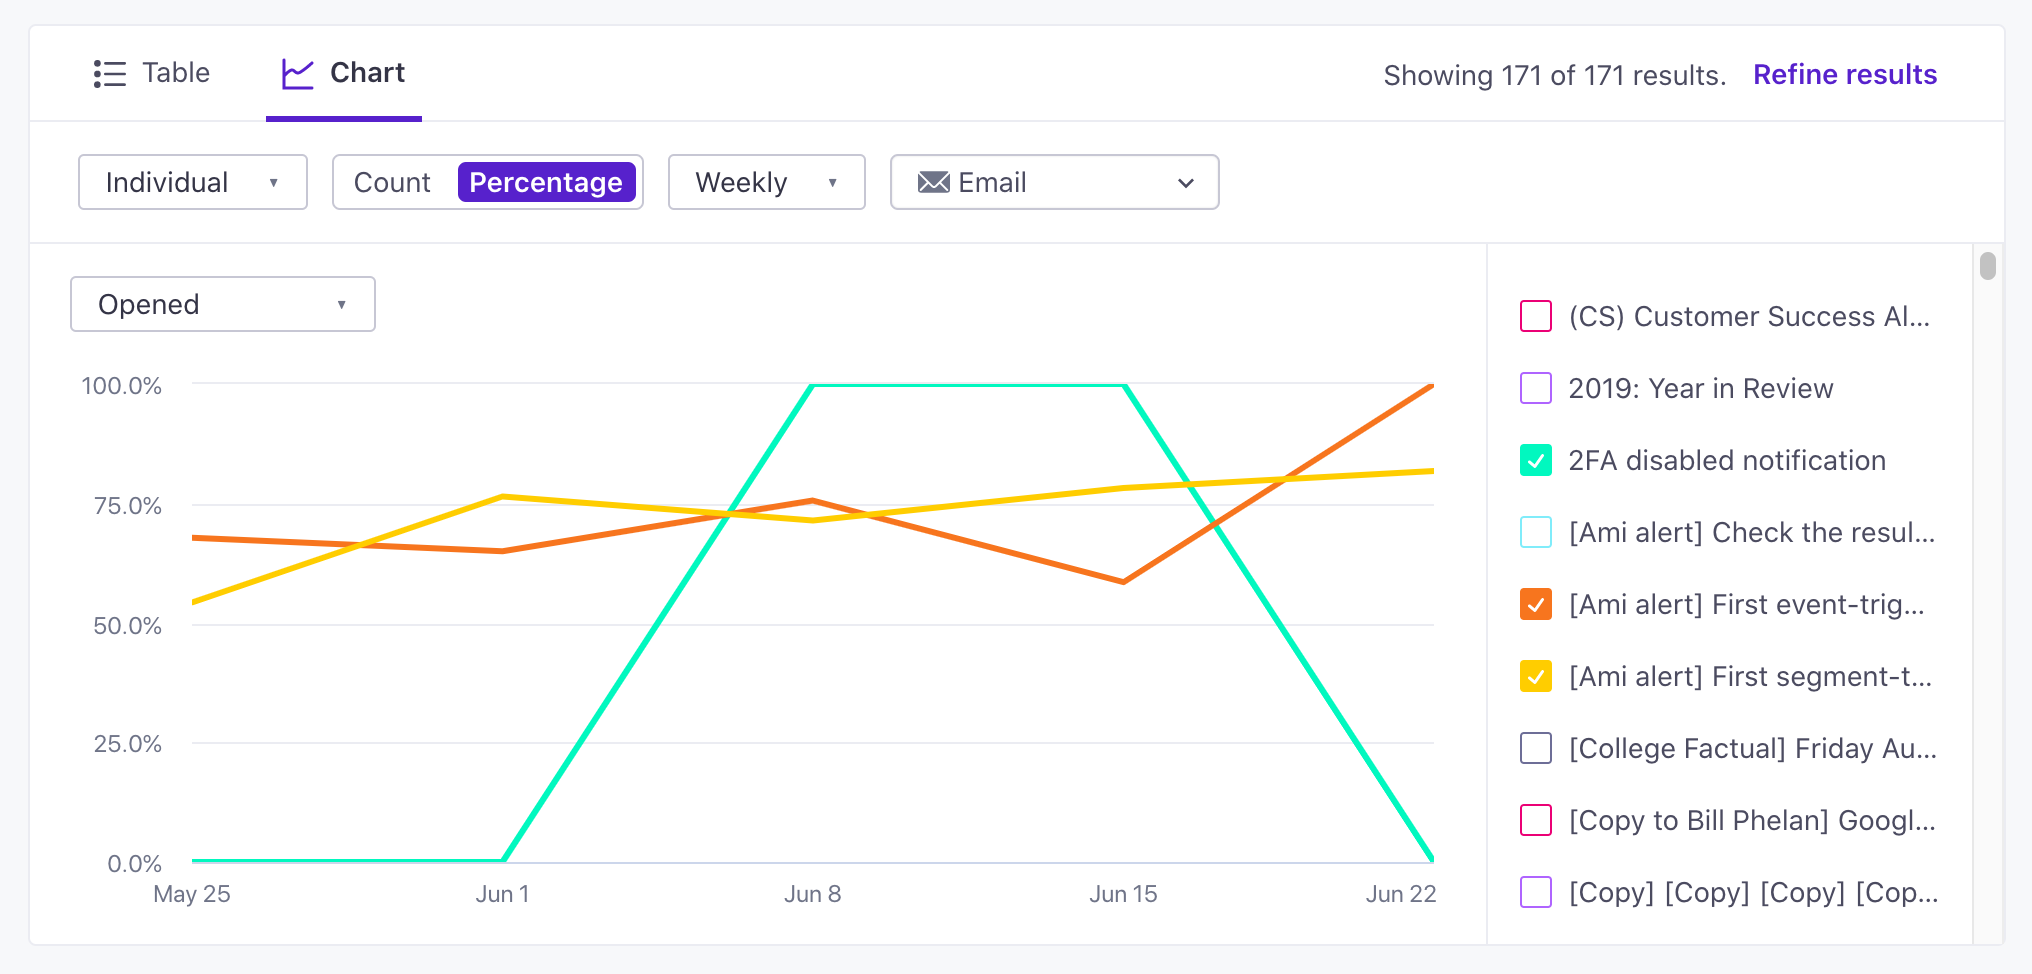
Chart view
The chart view of a report allows you to view metrics over time for the Campaigns, Newsletters, and Broadcasts that met the report criteria. You can view one metric over time for each Campaign, Newsletter, and Broadcast using the “Individual” chart type, or you can view the cumulative metrics of all results over time using the “Aggregate” chart view.
Both chart types can be viewed with percentage values or raw counts, grouped by daily, weekly, or monthly totals, and filtered by channel type.