Workspace Dashboard
The Workspace Dashboard gives you a high-level view of how everything in your workspace is running and performing.
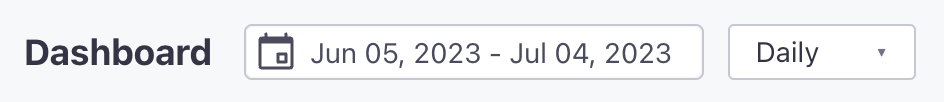
Select your reporting dates
Use the date picker to select the specific dates you want to see metrics for.
Select Daily or Weekly to set the frequency for metric calculations—the X-axis in charts, the number of messages calculated in performance metrics, etc.
Segments
The Segments card shows you how membership counts in your segments have changed over time. You can choose any Segment you want from the drop down. Your selection is saved for the next time you view the page. Pin the two Segments you care most about and keep an eye on them every time you log in.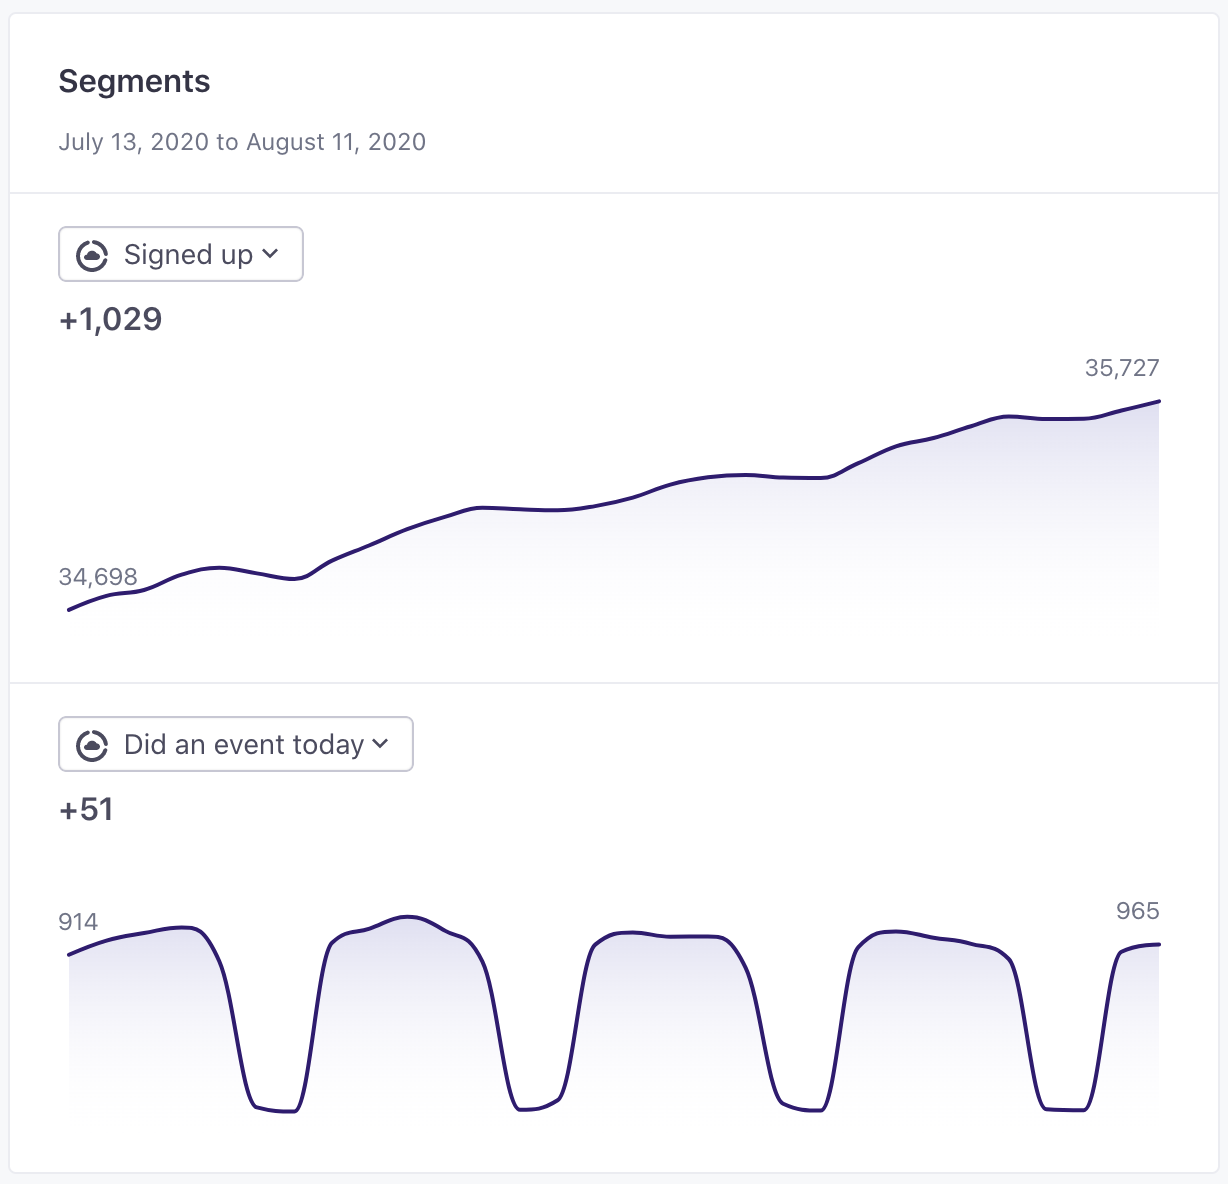
Leaderboard
The Leaderboard card shows which Campaigns and Broadcasts have the highest and lowest send, open, click, and conversion counts across the workspace. It can help you identify messaging strategies that work best, and highlight where you need to make improvements.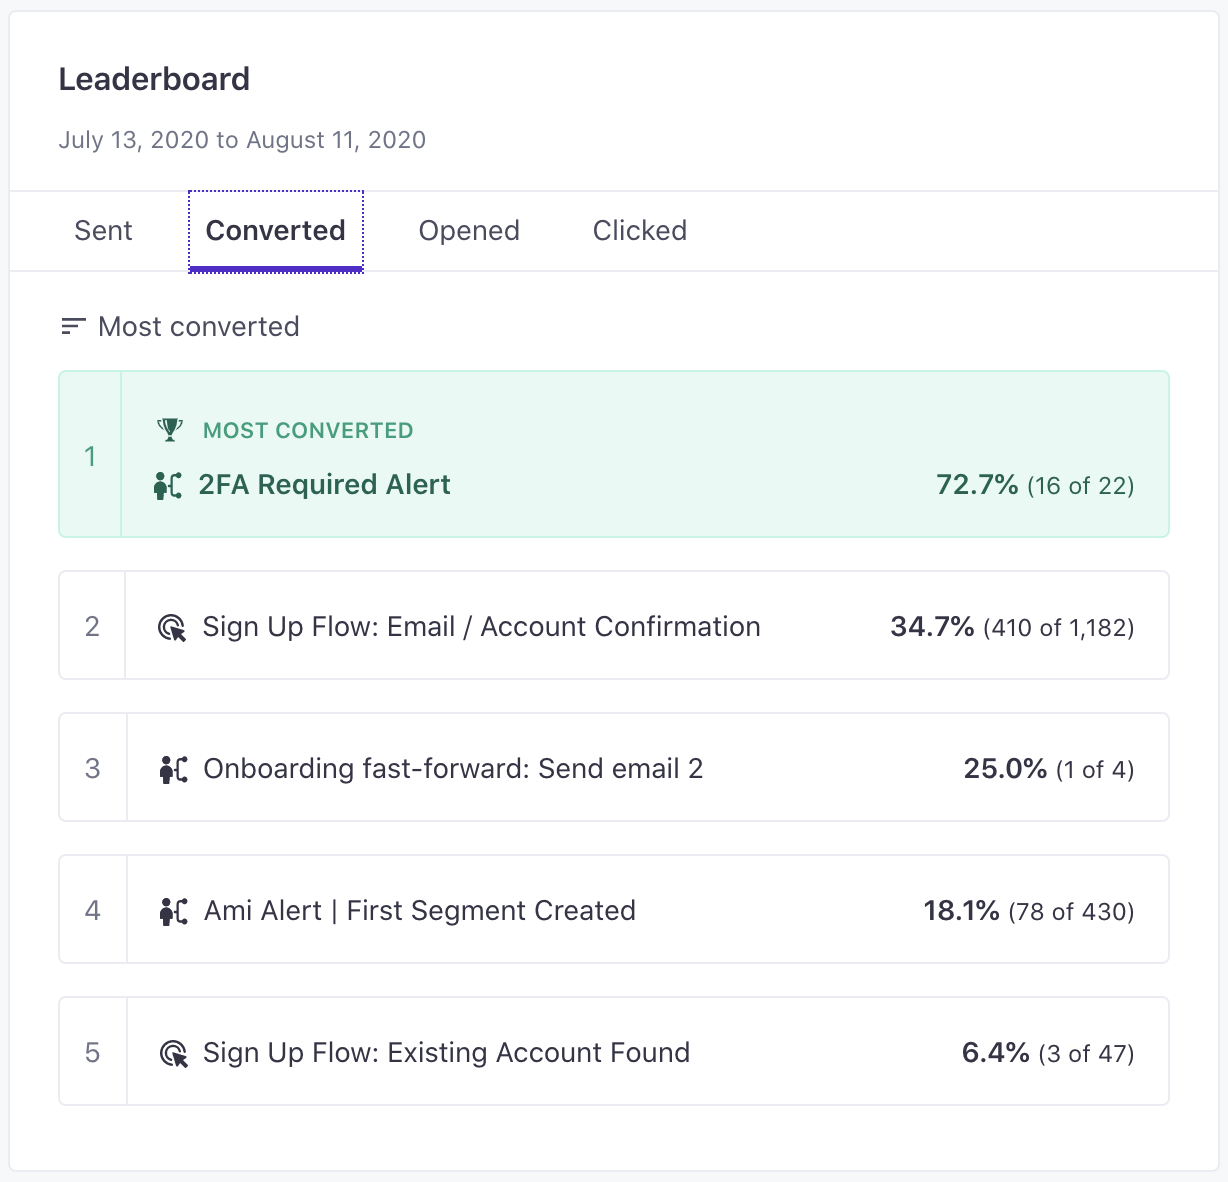
Performance and Delivery
The Performance and Delivery charts provide cumulative performance and delivery metrics for your entire workspace over a given time frame.
Performance
The Performance chart shows positive and negative metrics to help you understand how your messages perform among recipients. It tracks:
The user clicked on any link in a message where link tracking was enabled. We also track clicks on individual links. A message is marked as converted when an end-user meets your conversion goal and that was the last message received before the conversion goal was met, by default. Learn more about how conversions work. A message is counted as unsubscribed when a user unsubscribes from all messages. You can read more about how global unsubscribes work in Customer.io. For emails, this means that the end-user marked the email as ‘Spam’ via their email service provider. All subsequent emails are then marked “suppressed.”Clicked
Converted
Unsubscribed
Marked as spam
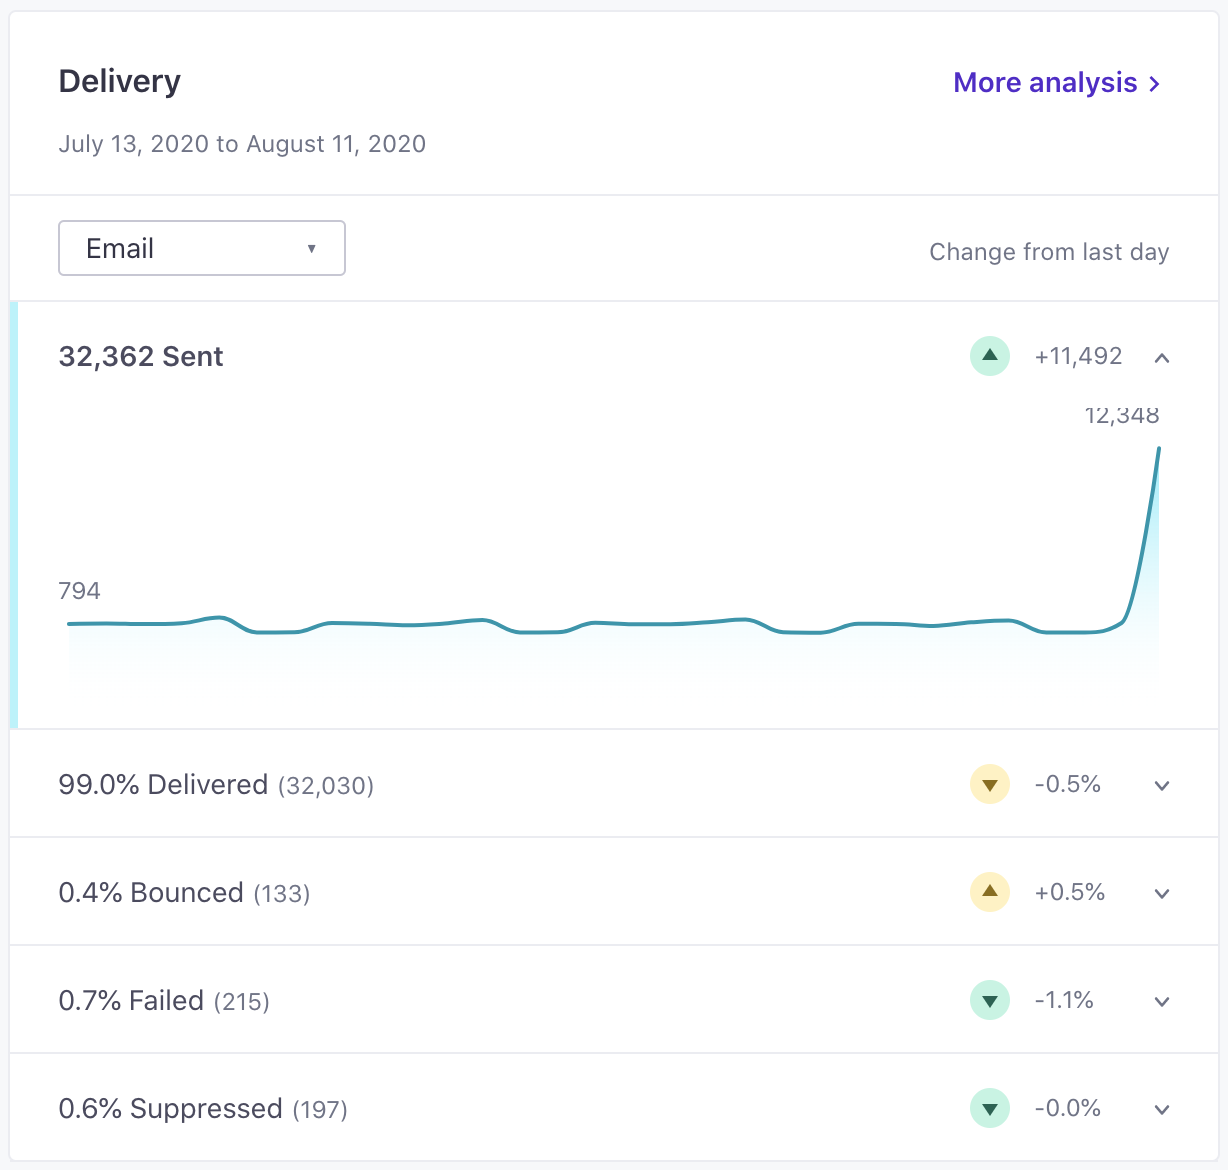
Delivery
The Delivery chart shows shows the percentage of your messages that make it to a recipient and the percentages of messages that bounce, fail, etc for any reason. You should monitor this chart for spikes in negative metrics that might affect your overall deliverability.
Delivered means that we’ve received confirmation from the delivery provider that a message was delivered to the recipient’s email service provider (ESP). For email, this means the user’s email address wasn’t valid. This could be a hard bounce (usually a permanent issue like a non-existent email address) or a soft bounce (a temporary issue like a full mail box). In the case of hard bounces for emails, subsequent messages to those addresses will be given the “suppressed” status. A failed message never made it to the delivery provider. We have a separate article to help you diagnose why your message never left Customer.io. A message is marked as suppressed if:Delivered
Bounced
Failed
Suppressed
Tests
The Tests card shows all of the A/B tests that are currently running in your workspace. It can help you track tests that have been running longer than necessary. Dive directly into the details of a test by clicking it in the list.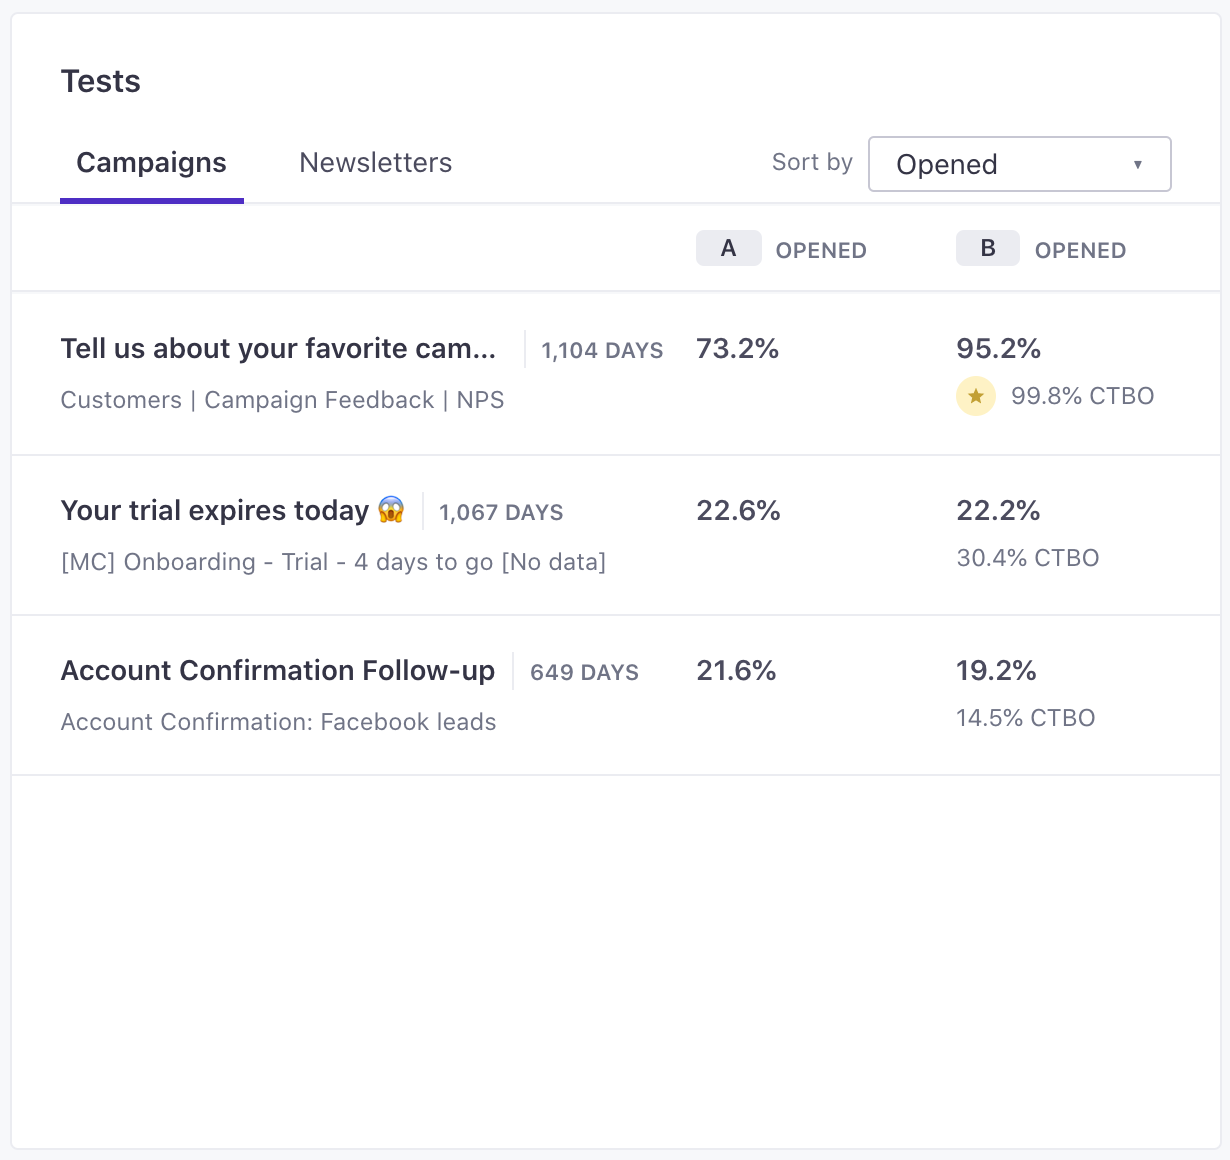
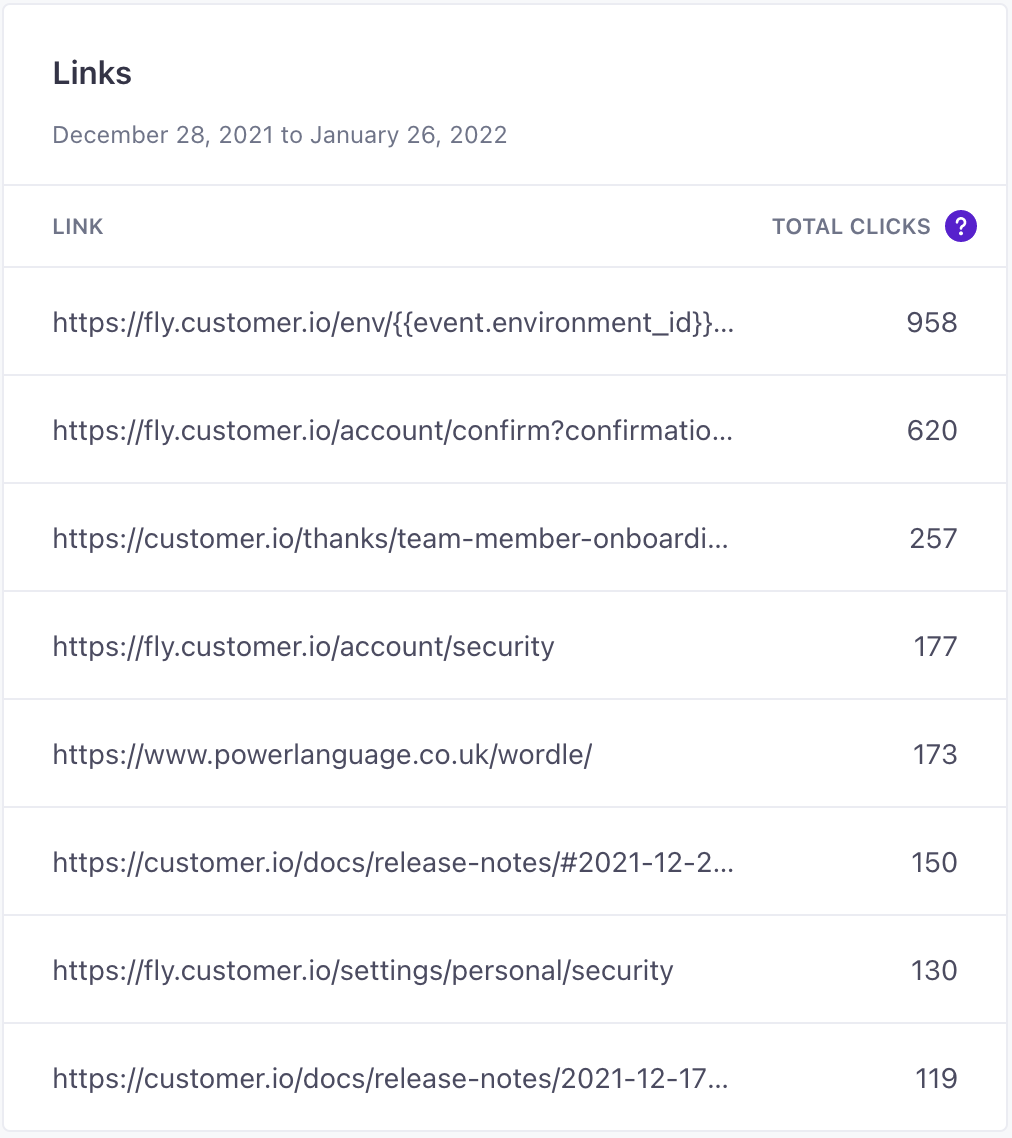
Links
The Links card shows the total link clicks for every link in your messages. It helps you understand how your calls to action perform over any time range, and across any channel.